Ingesting data with panpipes
Panpipes is a single-cell multimodal analysis pipeline that offers various functionalities to streamline and speed up your single-cell projects. It is divided into several modular workflows, that can be run independently or in combination.
Arguably, the most important part of a pipeline is the ingestion of the data into a format that allows efficient storage and agile processing. We believe that AnnData and MuData offer all those advantages and that’s why we built panpipes with these data structure at its core.
Please check the scverse website for more information on these formats!
When running panpipes, you always need to start with the data ingestion. The ingest workflow will do the following:
create summary plots of 10x metrics
calculate scrublet scores (doublet detection)
scanpy Quality Control (QC)
create summary QC plots
The ingest pipeline does not perform any filtering of cells or genes. Filtering occurs as the first step in the preprocess workflow, which should be executed after the ingestion workflow.
We provide examples of how to ingest single cell data starting either from 10X sequencing data (see the multiome tutorial or the CITE-Seq + VDJ tutorial) or directly from existing AnnData objects. Importantly, it is possible to load any tabular format and assay-specific data types into one MuData object, which will then used for the downstream analysis by panpipes. For further information on this, check the section on supported input filetypes and our tutorial on ingesting spatial transcriptomics data.
While going through the tutorials, you will notice that we append the –local flag to each command. This flag instructs the pipeline to run on the computing node you are currently using, namely your local machine or an interactive session on a computing node within an HPC cluster.
Note that if you are combining multiple datasets from different sources, the final AnnData object will only contain the intersection of the genes from all the datasets. For example, if the mitochondrial genes have been excluded from one of the inputs, they will be excluded from the final dataset. In this case, it might be wise to run ingest separately on each dataset and then merge them together to create one AnnData object to use as input for the integration workflow.
In the following, we will explain all the steps necessary to run the ingest workflow, which takes multi-modal single-cell data as input and formats them into a single MuData object.
1. Preparing the data
In this tutorial, we begin with data already stored in individual AnnData objects (file ending .h5ad) for each modality. If you want to start from another format, such as 10X outputs or CSV matrices, check out additional tutorials and information on supported data formats here.
To run this tutorial with the same data as we utilized, please download the input data that we have provided here. It’s a random subset of cells from the teaseq datasets, which was also utilized in the panpipes paper. Once downloaded, you should find three .h5ad objects in this directory, one for each modality of the teaseq experiment, namely rna, prot (in this case the object is saved as adt) and atac.
Next, create a directory in which panpipes will operate. To do so, navigate to the desired location for the folder and then create it by running the following command in your terminal (we call our directory teaseq):
mkdir teaseq
The teaseq directory serves as the top-level directory. For each workflow you run, create a separate directory to store the output of the respective workflow.
To create the directory for running the ingest workflow, execute the following:
cd teaseq
mkdir ingest && cd ingest

mkdir data.dir
Now move the three input AnnData objects (file ending .h5ad) that you downloaded into the data.dir folder you have just created. You should now have the following directory structure (check with ls or treecommands if necessary):
teaseq
├── ingest
│   ├── data.dir
│   │   ├── adt.h5ad
│   │   ├── atac.h5ad
│   │   └── rna.h5ad
Before moving onto preparing configuration and submission for ingest, rename the three AnnData objects (file ending .h5ad) to adt.h5ad, atac.h5ad and rna.h5ad, removing the prefix subsample_. You can do so using the move command (mv) and just adding the new name to the end of the path:
mv subsample_adt.h5ad teaseq/ingest/data.dir/adt.h5ad

mv subsample_atac.h5ad teaseq/ingest/data.dir/atac.h5ad

mv subsample_rna.h5ad teaseq/ingest/data.dir/rna.h5ad
2. Preparing the Configuration and Submission file for the ingest pipeline
In order to ingest the data, we have to tell panpipes the paths to each AnnData object, as well as specify other settings required to run ingest. For this purpose, panpipes uses config and submission files. The ingest workflow is the only one of the panpipes workflows that requires both a config and a submission file to run.
Configuration file
NOTE: We provide a detailed explanation of all the parameters that can be specified in the ingestion configuration file,
pipeline.yml. View here.
Go to the directory teaseq/ingest and call:
panpipes ingest config
This command will generate a pipeline.log and a pipeline.yml file. The pipeline.yml is our configuration file, providing the ingest workflow with essential information such as the path to the input data, the type of data, and the parameters for running your analysis.
Let’s have a look at the first part of the pipeline.yml file (in case you don’t want to create it yourself, you can also view and download the completed file here):
# --------------------------------
# Loading and merging data options
# --------------------------------

# ----------------------------
# Project name and data format
project: Teaseq
sample_prefix: teaseq
use_existing_h5mu: False
submission_file: sample_file_qc.txt
metadatacols:
concat_join_type: inner

#--------------------------
# Modalities in the project
modalities:
  rna: True
  prot: True
  bcr: False
  tcr: False
  atac: True
In the excerpt from the pipeline.yml above, we specify the following:
We specify the name of the sample that will be generated when combining the individual single-cell modalities into a single
MuDataobject:teaseqWe provide the name of the input submission file that should be located in the current directory:
sample_file_qc.txtWe instruct the pipeline to perform an inner join when combining the unimodal assays. As a result, panpipes will only work with cells that have measurements for all three modalities and discard those that don’t meet this criterion (i.e., don’t have measurements for all modalities).
There are many more parameters that can be specified in the configuration file. Important ones are:
Specify whether to run doublet detection on RNA data using scrublet (
True/False):
scr:
  run: True
Choose the normalization method to use for protein data. Since, for the data used in this tutorial, we don’t have access to
cellrangerfiles to estimate the background protein data, the only normalization we can use isclr:
normalisation_methods: clr

#-----------------------------------------------
# Centered log ratio (CLR) normalization options

# margin determines whether you normalise per cell (as you would for RNA),
# or by feature (recommended, due to the variable nature of prot assays).
# CLR margin 0 is recommended for informative qc plots in this pipeline
# 0 = normalise row-wise (per cell)
# 1 = normalise column-wise (per feature)
clr_margin: 1
Specify which Quality Control (QC) covariates should be plotted for each modality:
# ------------------------
# Plotting RNA QC metrics
# all metrics should be provided as a comma separated string e.g. a,b,c
plotqc_grouping_var: orig.ident
plotqc_rna_metrics: doublet_scores,pct_counts_mt,pct_counts_rp,pct_counts_hb,pct_counts_ig

# ----------------------------
# Plotting Protein QC metrics

# requires prot_path to be included in the submission file
# all metrics should be provided as a comma separated string e.g. a,b,c
plotqc_prot_metrics: total_counts,log1p_total_counts,n_adt_by_counts,pct_counts_isotype
prot_metrics_per_prot: total_counts,log1p_total_counts,n_cells_by_counts,mean_counts
One can specify many more parameters in the configuration file, pipeline.yml, which are all described in the file itself.
We reccomend you closely inspect the pipeline.yml file to familiarize yourself with all the options.
To progress with the tutorial, you can either modify the pipeline.yml with custom parameters, or simply replace the file with the one we provide here.
Please note that the parameters specified for modalities that are not part of the experiment are ignored by the workflow (for the data used in this tutorial, we are not processing bcr and tcr data).
Submission file
This is the sumbission file we are using for this tutorial (we provide it here):
sample_id |
rna_path |
rna_filetype |
prot_path |
prot_filetype |
atac_path |
atac_filetype |
tissue |
|---|---|---|---|---|---|---|---|
teaseq |
data.dir/rna.h5ad |
h5ad |
data.dir/adt.h5ad |
h5ad |
data.dir/atac.h5ad |
h5ad |
pbmc |
Specifying paths
As part of the ingest workflow, we additionally specify a series of custom paths to the files that contains the genes used for qc’ing the cells. We provide an example file that contains gene pathways that are associated to commonly used signatures, like mitochondrial or ribosomal genes. These genes are used to score the cells for enrichment of specific signatures, and to flag cells with high percentage mitochondrial reads. We explain more on how to supply and use these custom genes list in the usage section, check it out!
Download this file here
remember to change the following paths to the files on your local machine!
We need to provide the correct conda environment if using one (you can also leave empty if using python venv)
We need to specify the path to the
sample_qc_file.txtsubmission fileWe need to provide the path to the
qc_genelist_1.0.csvfile that you downloaded or customized.
3. Running the workflow
Review the steps that are going to be run as part of the ingest pipeline:
panpipes ingest show full --local
This is the output which describes all the tasks which will be run:
Task = "mkdir('logs') #2   before pipeline_ingest.load_mudatas "
Task = 'pipeline_ingest.load_mudatas'
Task = 'pipeline_ingest.concat_filtered_mudatas'
Task = 'pipeline_ingest.run_scrublet'
Task = 'pipeline_ingest.run_rna_qc'
Task = "mkdir('logs') #2   before pipeline_ingest.load_bg_mudatas "
Task = 'pipeline_ingest.load_bg_mudatas'
Task = 'pipeline_ingest.downsample_bg_mudatas'
Task = 'pipeline_ingest.concat_bg_mudatas'
Task = 'pipeline_ingest.run_scanpy_prot_qc'
Task = 'pipeline_ingest.run_dsb_clr'
Task = 'pipeline_ingest.run_prot_qc'
Task = 'pipeline_ingest.run_repertoire_qc'
Task = 'pipeline_ingest.run_atac_qc'
Task = 'pipeline_ingest.run_qc'
Task = 'pipeline_ingest.run_assess_background'
Task = 'pipeline_ingest.plot_qc'
Task = 'pipeline_ingest.all_rna_qc'
Task = 'pipeline_ingest.all_prot_qc'
Task = "mkdir('logs')   before pipeline_ingest.aggregate_tenx_metrics_multi "
Task = 'pipeline_ingest.aggregate_tenx_metrics_multi'
Task = 'pipeline_ingest.process_all_tenx_metrics'
Task = 'pipeline_ingest.full'
Now to run the complete ingest workflow type:
panpipes ingest make full --local
That’s it. If running successfully you should see that the pipeline prints the tasks it’s running to the stdout.
This output is also appended to the pipeline.log file that was generated when configuring the workflow, so you can keep track of what is happening.
# 2023-11-20 14:37:45,205 INFO running statement: \
#                              python /Users/fabiola.curion/Documents/devel/github/panpipes/panpipes/python_scripts/make_adata_from_csv.py          --mode_dictionary "{'rna': True, 'prot': True, 'bcr': False, 'tcr': False, 'atac': True}"         --sample_id teaseq         --output_file ./tmp/teaseq.h5mu       --use_muon True --rna_infile data.dir/rna.h5ad --rna_filetype h5ad --prot_infile data.dir/adt.h5ad --prot_filetype h5ad --subset_prot_barcodes_to_rna False --atac_infile data.dir/atac.h5ad --atac_filetype h5ad > logs/load_mudatas_teaseq.log

# 2023-11-20 14:38:36,863 INFO {"task": "pipeline_ingest.load_mudatas", "engine": "LocalExecutor", "statement": "python /Users/fabiola.curion/Documents/devel/github/panpipes/panpipes/python_scripts/make_adata_from_csv.py          --mode_dictionary \"{'rna': True, 'prot': True, 'bcr': False, 'tcr': False, 'atac': True}\"         --sample_id teaseq         --output_file ./tmp/teaseq.h5mu       --use_muon True --rna_infile data.dir/rna.h5ad --rna_filetype h5ad --prot_infile data.dir/adt.h5ad --prot_filetype h5ad --subset_prot_barcodes_to_rna False --atac_infile data.dir/atac.h5ad --atac_filetype h5ad > logs/load_mudatas_teaseq.log", "job_id": 71009, "slots": 1, "start_time": 1700487466.1516511, "end_time": 1700487516.860606, "submission_time": 1700487466.1516511, "hostname": "MB084405", "total_t": 50.70895481109619, "exit_status": 0, "user_t": 44.91, "sys_t": 2.33, "wall_t": 50.67, "shared_data": 0, "io_input": 0, "io_output": 0, "average_memory_total": 0, "percent_cpu": 93.15908832272535, "average_rss": 0, "max_rss": 712700, "max_vmem": 712700, "minor_page_faults": 285052, "swapped": 0, "context_switches_involuntarily": 22936, "context_switches_voluntarily": 6284, "average_uss": 0, "signal": 1, "major_page_fault": 3860, "unshared_data": 0, "cpu_t": 47.239999999999995}

# 2023-11-20 14:38:36,869 INFO {"task": "'pipeline_ingest.load_mudatas'", "task_status": "completed", "task_total": 1, "task_completed": 0, "task_completed_percent": 0.0}
# 2023-11-20 14:38:36,869 INFO Completed Task = 'pipeline_ingest.load_mudatas'
panpipes ingest will produce a host of different files including tab-separated metadata, plots and most notably a *_unfilt.h5mu object containing all the cells and the metadata, with calculated QC metrics such as pct_counts_mt,pct_counts_mt for percentage mitochondrial/ribosomal reads, total_counts for any of the supported modalities that use this info (such as rna, prot or atac), and other custom ones you may speficy by customizing the pipeline.yml.
file |
type file |
info |
|---|---|---|
data.dir |
directory |
the folder with input files we organized |
figures |
directory |
folder storing plots generated throughout the ingest workflow |
logs |
directory |
folder storing logs generated throughout the ingest workflow |
teaseq_cell_metadata.tsv |
text file |
the cell metadata of the experiment (the .obs slot of the mudata object) saved as a tsv file |
teaseq_threshold_filter.tsv |
text file |
summary file showing percentage of cells remaining for commonly used QC thresholds on genes and cells. This filtering is not applied in the ingest workflow. |
teaseq_threshold_filter_explained.tsv |
text file |
file containing the thresholds used to produce the previous file |
teaseq_unfilt.h5mu |
h5mu |
the mudata generated from the input files |
sample_file_qc.txt |
text file |
input sample submission file |
pipeline.log |
log |
pipeline log file, stores all the info on the commands run |
pipeline.yml |
yaml |
input yaml file |
scrublet |
directory |
directory storing the scrublet analysis results |
tmp |
directory |
directory storing temporary h5mu files (one for each sample in the submission file) |
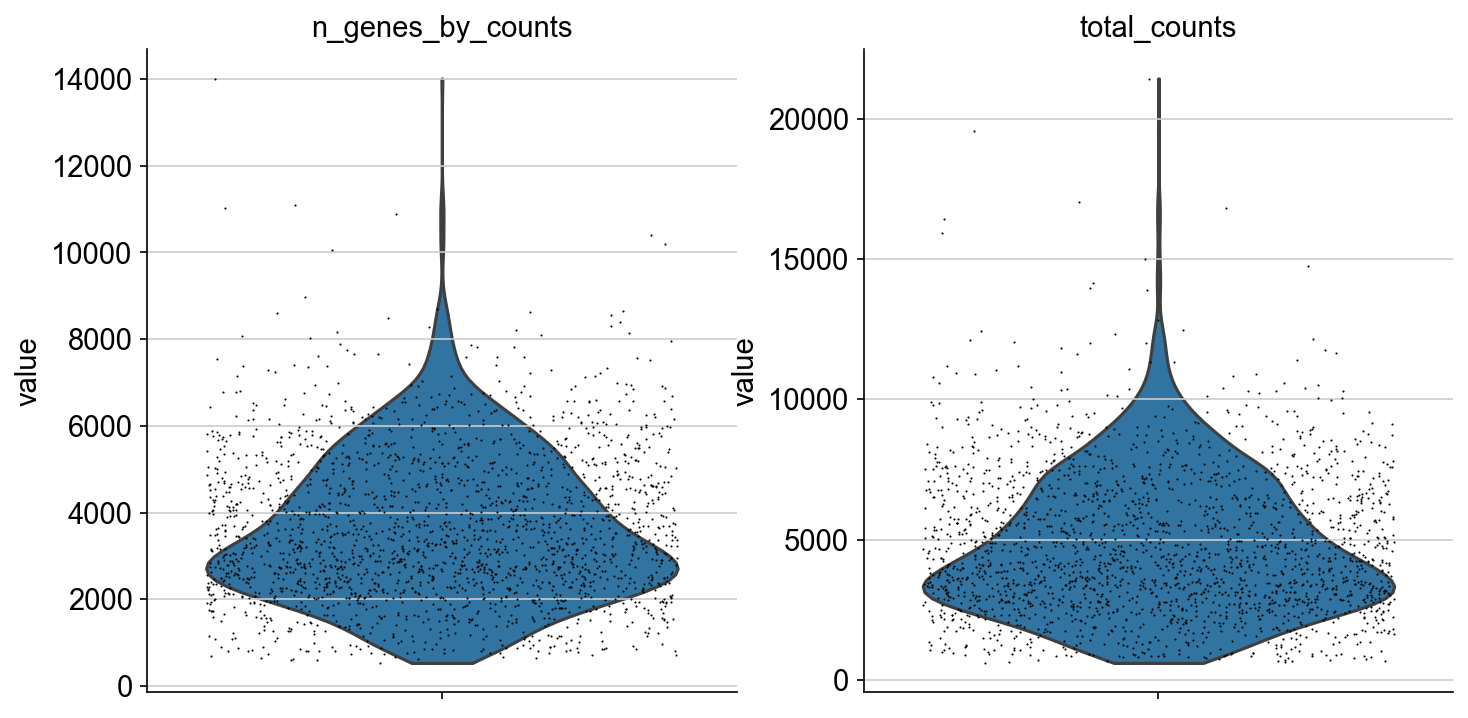
Some example figures include:
Scatterplots and violin plots for each modality
In this example, a violin plot of the computed atac metrics
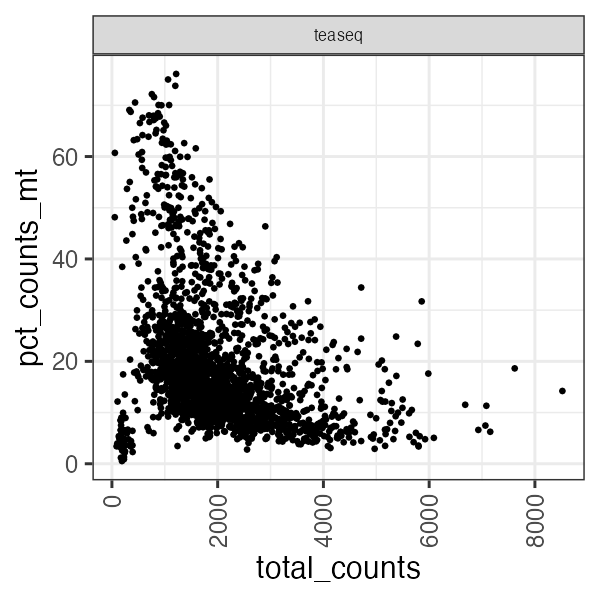
Or a scatterplot of the RNA total counts vs percentage genes mapping to mitochondrial reads in each cell.
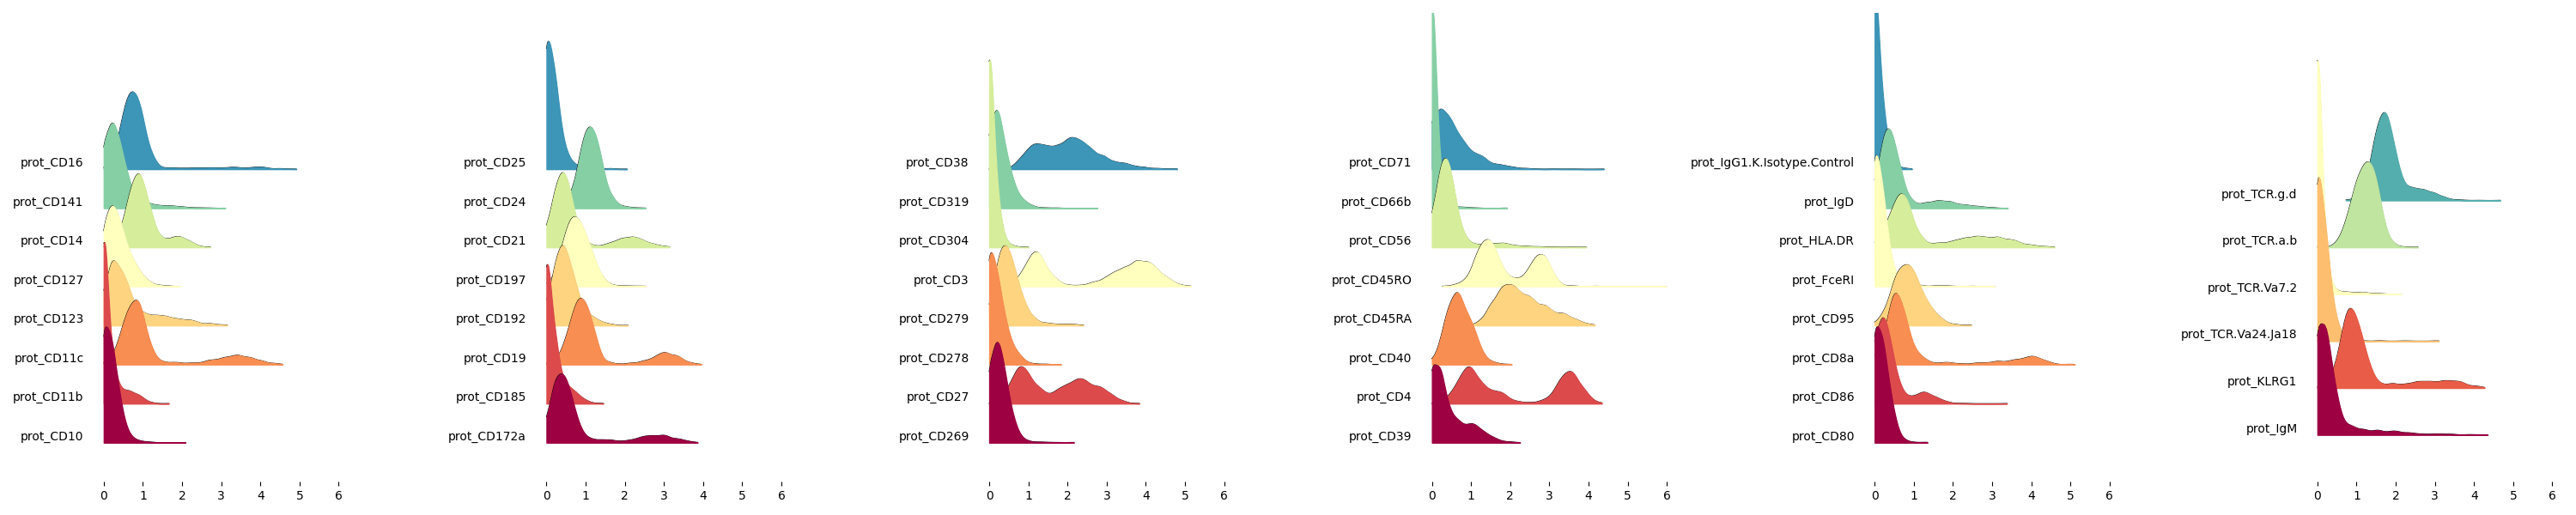
Ridgeplots of CLR normalized protein values in the experiment
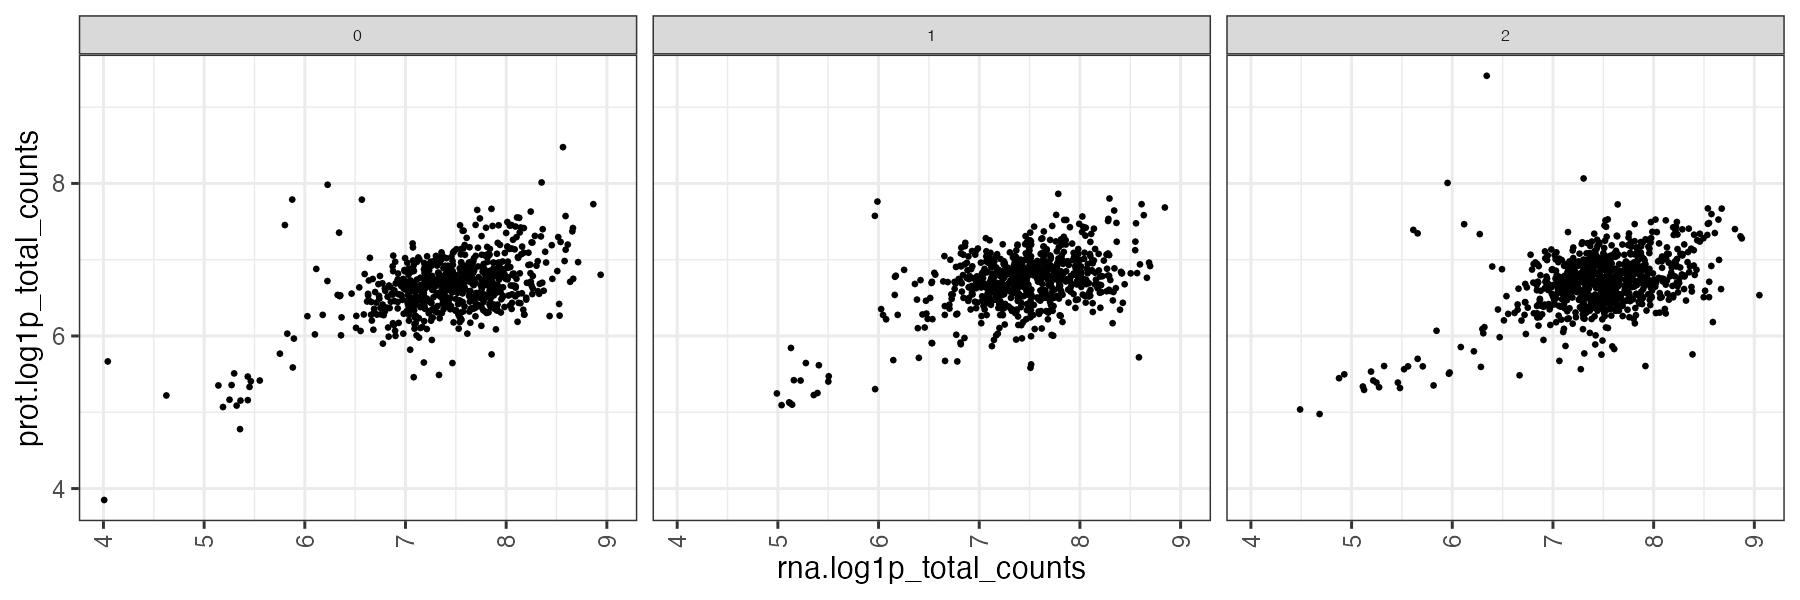
Particularly interesting may be plots comparing one modality to the other, for example exploration of normalized PROT vs RNA counts can provide a quick overview of cells where one modality may be incomplete or sparser than expected (see the cells that strongly deviate from the expected correlation)

The same plot can be produced for different grouping covariates. In this example we used the “sample_id” which is the value we specified in the submission file, that will become the sample name of the concatenated MuData object produced after the ingestion.
Since the the unimodal annadata we used for the tutorial also had the original samples covariates stored in the .obs, we have used the covariate “orig.ident” from the protein modality to show the scatterplot of log1p_nUMI in RNA vs PROT across the 3 teaseq samples of the original experiment.
the naming of the plots allows to identify the output:
scatter_prot.orig.ident-log1p_nUMI_v_rna-log1p_nUMI.png:
scatter: the type of plot (values: scatter/violin/barplot)
prot.orig.ident: the grouping var used (“orig.ident” from the prot modality)
log1p_nUMI_v_rna-log1p_nUMI: the X and Y coordinates of the scatterplot
You can also run individual steps, i.e. panpipes ingest make plot_qc --local will produce the qc plots from the metadata you have generated. In the pipeline_ingest.py workflow script, you can see that this step follows the qc metrics calculation for the each of the multimodal assays.
@follows(run_rna_qc, run_prot_qc, run_repertoire_qc, run_atac_qc)
def run_qc():
    pass

@follows(run_qc)
@originate("logs/plot_qc.log", orfile())
def plot_qc(log_file, cell_file):
    qcmetrics = PARAMS['plotqc_rna_metrics']
    cmd = """
    Rscript %(r_path)s/plotQC.R
    --prefilter TRUE
    --cell_metadata %(cell_file)s
    --sampleprefix %(sample_prefix)s
    --groupingvar %(plotqc_grouping_var)s
[...]
If you have run a full workflow and want to reproduce the output of one task (for example you have changed some of the parameters in the yml file), you have to remove the outputs of that task from the directory, so the pipeline knows where to start from.
To reproduce the plots, you have to remove the plot_qc.log file from the logs folder, and the workflow will pick up from there.
Please note that there are more complex tasks involving multiple output files, so in order to reproduce a step or the entire workflow for a different set of parameters it’s advisable to remove all outputs.
Next Steps:
Filtering the cells using panpipes preprocess
Note: We find that keeping the suggested directory structure (one main directory by project with all the individual steps in separate folders) is useful for project management. You can of course customize your directories as you prefer, and change the paths accordingly in the pipeline.yml config files!