Ingesting multiome datasets from cellranger arc outputs
Panpipes can read files from different cellranger outputs. Here we will showcase the example of a multiome dataset from the 10x website. Download the files from the 10x website
For this tutorial, we have downloaded the files in a folder 10Xmultiome_granulocytes and we generated softlinks to simulate the filenames that are the standard output of the cellranger arc pipeline.
These filenames are the expected inputs to panpipes.
Create your ingestion folder and organize the input data.
mkdir momedocs && cd $_
mkdir data.dir

# Here we show how the input data is organized

tree data.dir
data.dir
├── atac_fragments.tsv.gz -> ../10Xmultiome_granulocytes/atac_fragments.tsv.gz
├── atac_fragments.tsv.gz.tbi -> ../10Xmultiome_granulocytes/atac_fragments.tsv.gz.tbi
├── atac_peak_annotation.tsv -> ../10Xmultiome_granulocytes/atac_peak_annotation.tsv
├── filtered_feature_bc_matrix.h5 -> ../10Xmultiome_granulocytes/filtered_feature_bc_matrix.h5
├── pbmc_granulocyte_sorted_10k_atac_fragments.tsv.gz -> ../10Xmultiome_granulocytes/pbmc_granulocyte_sorted_10k_atac_fragments.tsv.gz
├── pbmc_granulocyte_sorted_10k_atac_fragments.tsv.gz.tbi -> ../10Xmultiome_granulocytes/pbmc_granulocyte_sorted_10k_atac_fragments.tsv.gz.tbi
├── pbmc_granulocyte_sorted_10k_atac_peak_annotation.tsv -> ../10Xmultiome_granulocytes/pbmc_granulocyte_sorted_10k_atac_peak_annotation.tsv
├── pbmc_granulocyte_sorted_10k_filtered_feature_bc_matrix.h5 -> ../10Xmultiome_granulocytes/pbmc_granulocyte_sorted_10k_filtered_feature_bc_matrix.h5
├── pbmc_granulocyte_sorted_10k_per_barcode_metrics.csv -> ../10Xmultiome_granulocytes/pbmc_granulocyte_sorted_10k_per_barcode_metrics.csv
├── pbmc_granulocyte_sorted_10k_summary.csv
└── summary.csv -> pbmc_granulocyte_sorted_10k_summary.csv
We created a sample submission file which will instruct panpipes on how to find each modality’s path. Download this submission file here.
Besides the first column, “sample_id”, the order in which the columns are provided is not fixed, but the column names are fixed! Failing to specify the column names will result in omission of the modality from the analysis and early stopping of the pipeline. We find useful to generate the submission file with softwares like Numbers or Excel and save the output as a txt file to ensure that the file is properly formatted. For more examples please check our documentation on sample submission files.
This is the sample submission file we are using for this tutorial:
sample_id |
atac_path |
atac_filetype |
fragments_file |
per_barcode_metrics_file |
peak_annotation_file |
tissue |
diagnosis |
rna_path |
rna_filetype |
|---|---|---|---|---|---|---|---|---|---|
mome_granulocytes |
data.dir/filtered_feature_bc_matrix.h5 |
10X_h5 |
data.dir/atac_fragments.tsv.gz |
data.dir/pbmc_granulocyte_sorted_10k_per_barcode_metrics.csv |
data.dir/atac_peak_annotation.tsv |
granulocytes |
healthy |
data.dir/filtered_feature_bc_matrix.h5 |
10X_h5 |
Make sure the submission file is in the main directory you have generated:
ls -l momedocs

10Xmultiome_granulocytes
data.dir
multiomecaf.txt
Now, activate the environment in which you have installed panpipes and configure the ingest workflow.
panpipes ingest config
This command will generate a config file, pipeline.yml. Modify the config file to read in the sample submission file provided. You can find the preconfigured pipeline.yml file here.
Please remember to apply the necessary changes in this file to ensure it will run on your computer, and specify:
the environment in which you’re running panpipes, if applicable.
the path to the custom_genes_file that we use to run scanpy.score.genes (we provide an example file in the panpipes’ resources folder)
Now, run the full panpipes ingestion workflow with:
panpipes ingest make full
The pipeline will write to standard output and to a pipeline.log file about the steps it’s running. When it’s finished, you will see a message:
# 2023-10-12 16:02:07,160 INFO Completed Task = 'pipeline_ingest.full'
# 2023-10-12 16:02:07,267 INFO job finished in 74 seconds at Thu Oct 12 16:02:07 2023 -- 10.63  1.72 61.48  7.78 -- badc0e60-8451-4e84-b47e-3754f3f913e4
Let’s inspect the outputs we have generated with panpipes ingest
tree ../momedocs -L 1

├── 10Xmultiome_granulocytes
├── 10x_metrics.csv
├── data.dir
├── figures
├── logs
├── mome_cell_metadata.tsv
├── mome_threshold_filter.tsv
├── mome_threshold_filter_explained.tsv
├── mome_unfilt.h5mu
├── multiomecaf.txt
├── pipeline.log
├── pipeline.yml
├── raw_mome.tar.gz
├── scrublet
└── tmp
file |
type file |
info |
|---|---|---|
10Xmultiome_granulocytes |
directory |
the folder we downloaded |
10x_metrics.csv |
text file |
output file from parsing the cellranger summary_metrics file |
data.dir |
directory |
the folder with input files we organized |
figures |
directory |
folder storing plots generated throughout the ingest workflow |
logs |
directory |
folder storing logs generated throughout the ingest workflow |
mome_cell_metadata.tsv |
text file |
the cell metadata of the experiment (the .obs slot of the mudata object) saved as a tsv file |
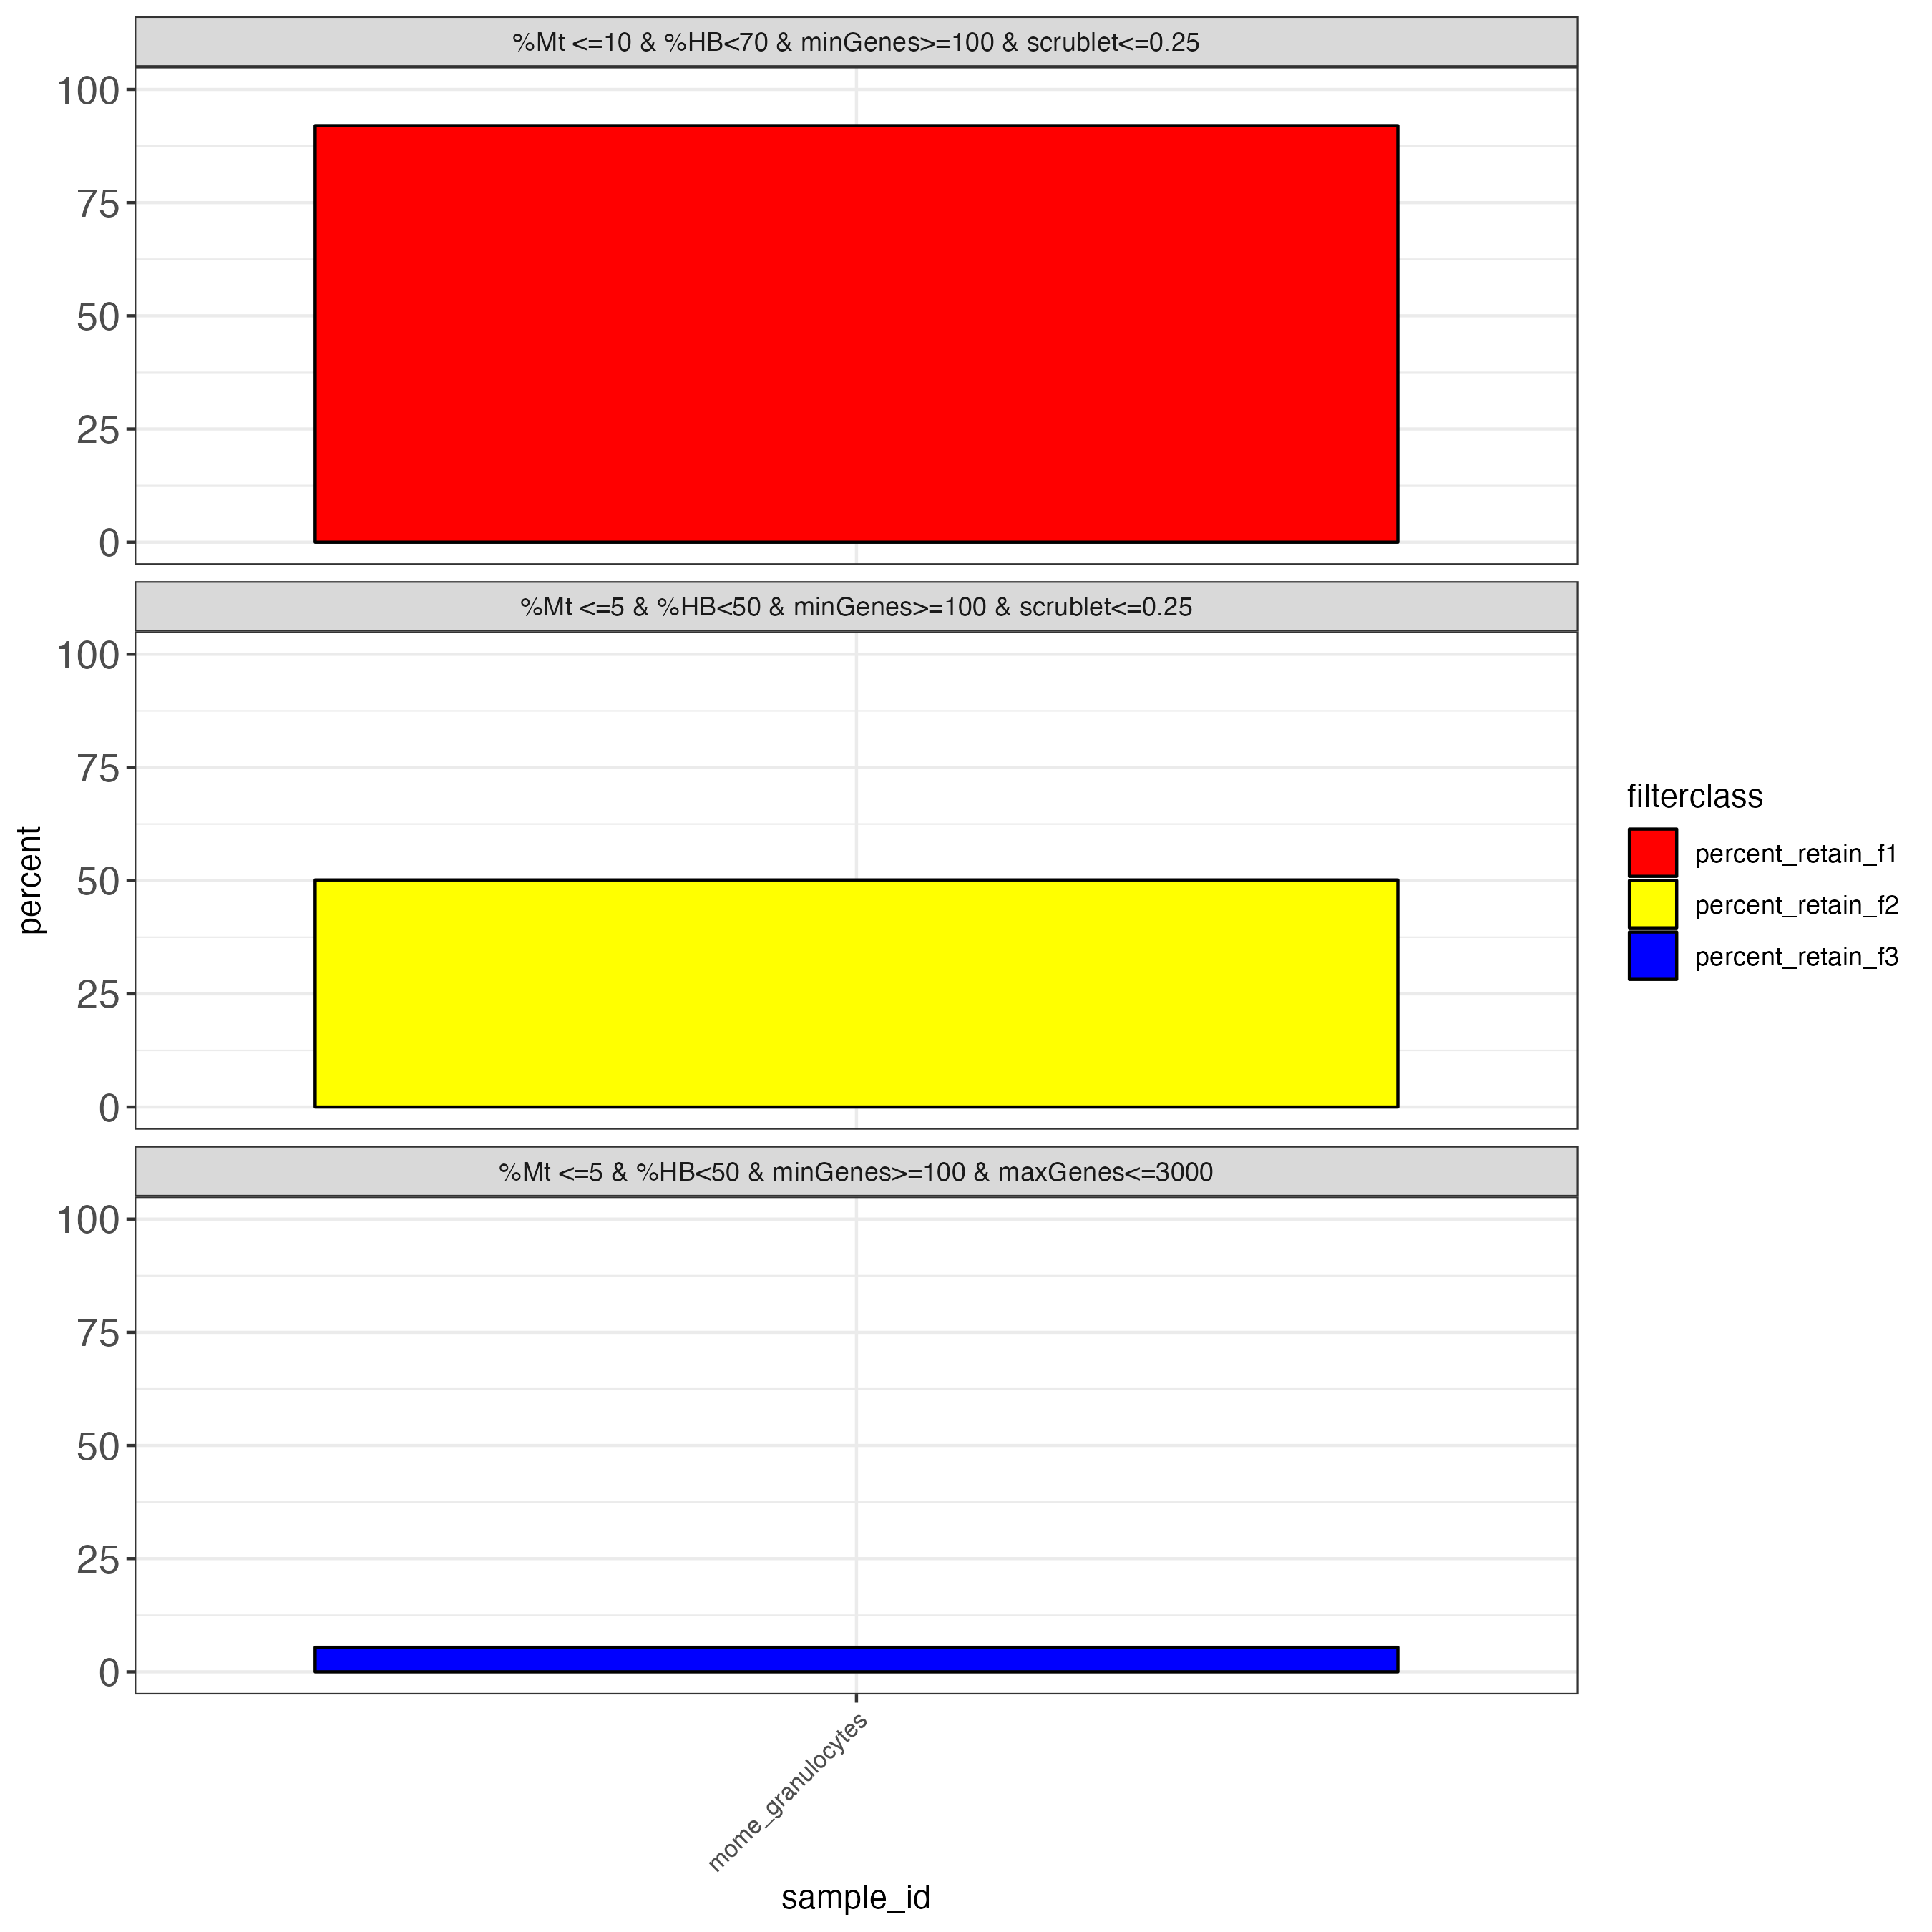
mome_threshold_filter.tsv |
text file |
summary file showing percentage of cells remaining for commonly used QC thresholds on genes and cells. This filtering is not applied in the ingest workflow. |
mome_threshold_filter_explained.tsv |
text file |
file containing the thresholds used to produce the previous file |
mome_unfilt.h5mu |
h5mu |
the mudata generated from the input files |
multiomecaf.txt |
text file |
input sample submission file |
pipeline.log |
log |
pipeline log file, stores all the info on the commands run |
pipeline.yml |
yaml |
input yaml file |
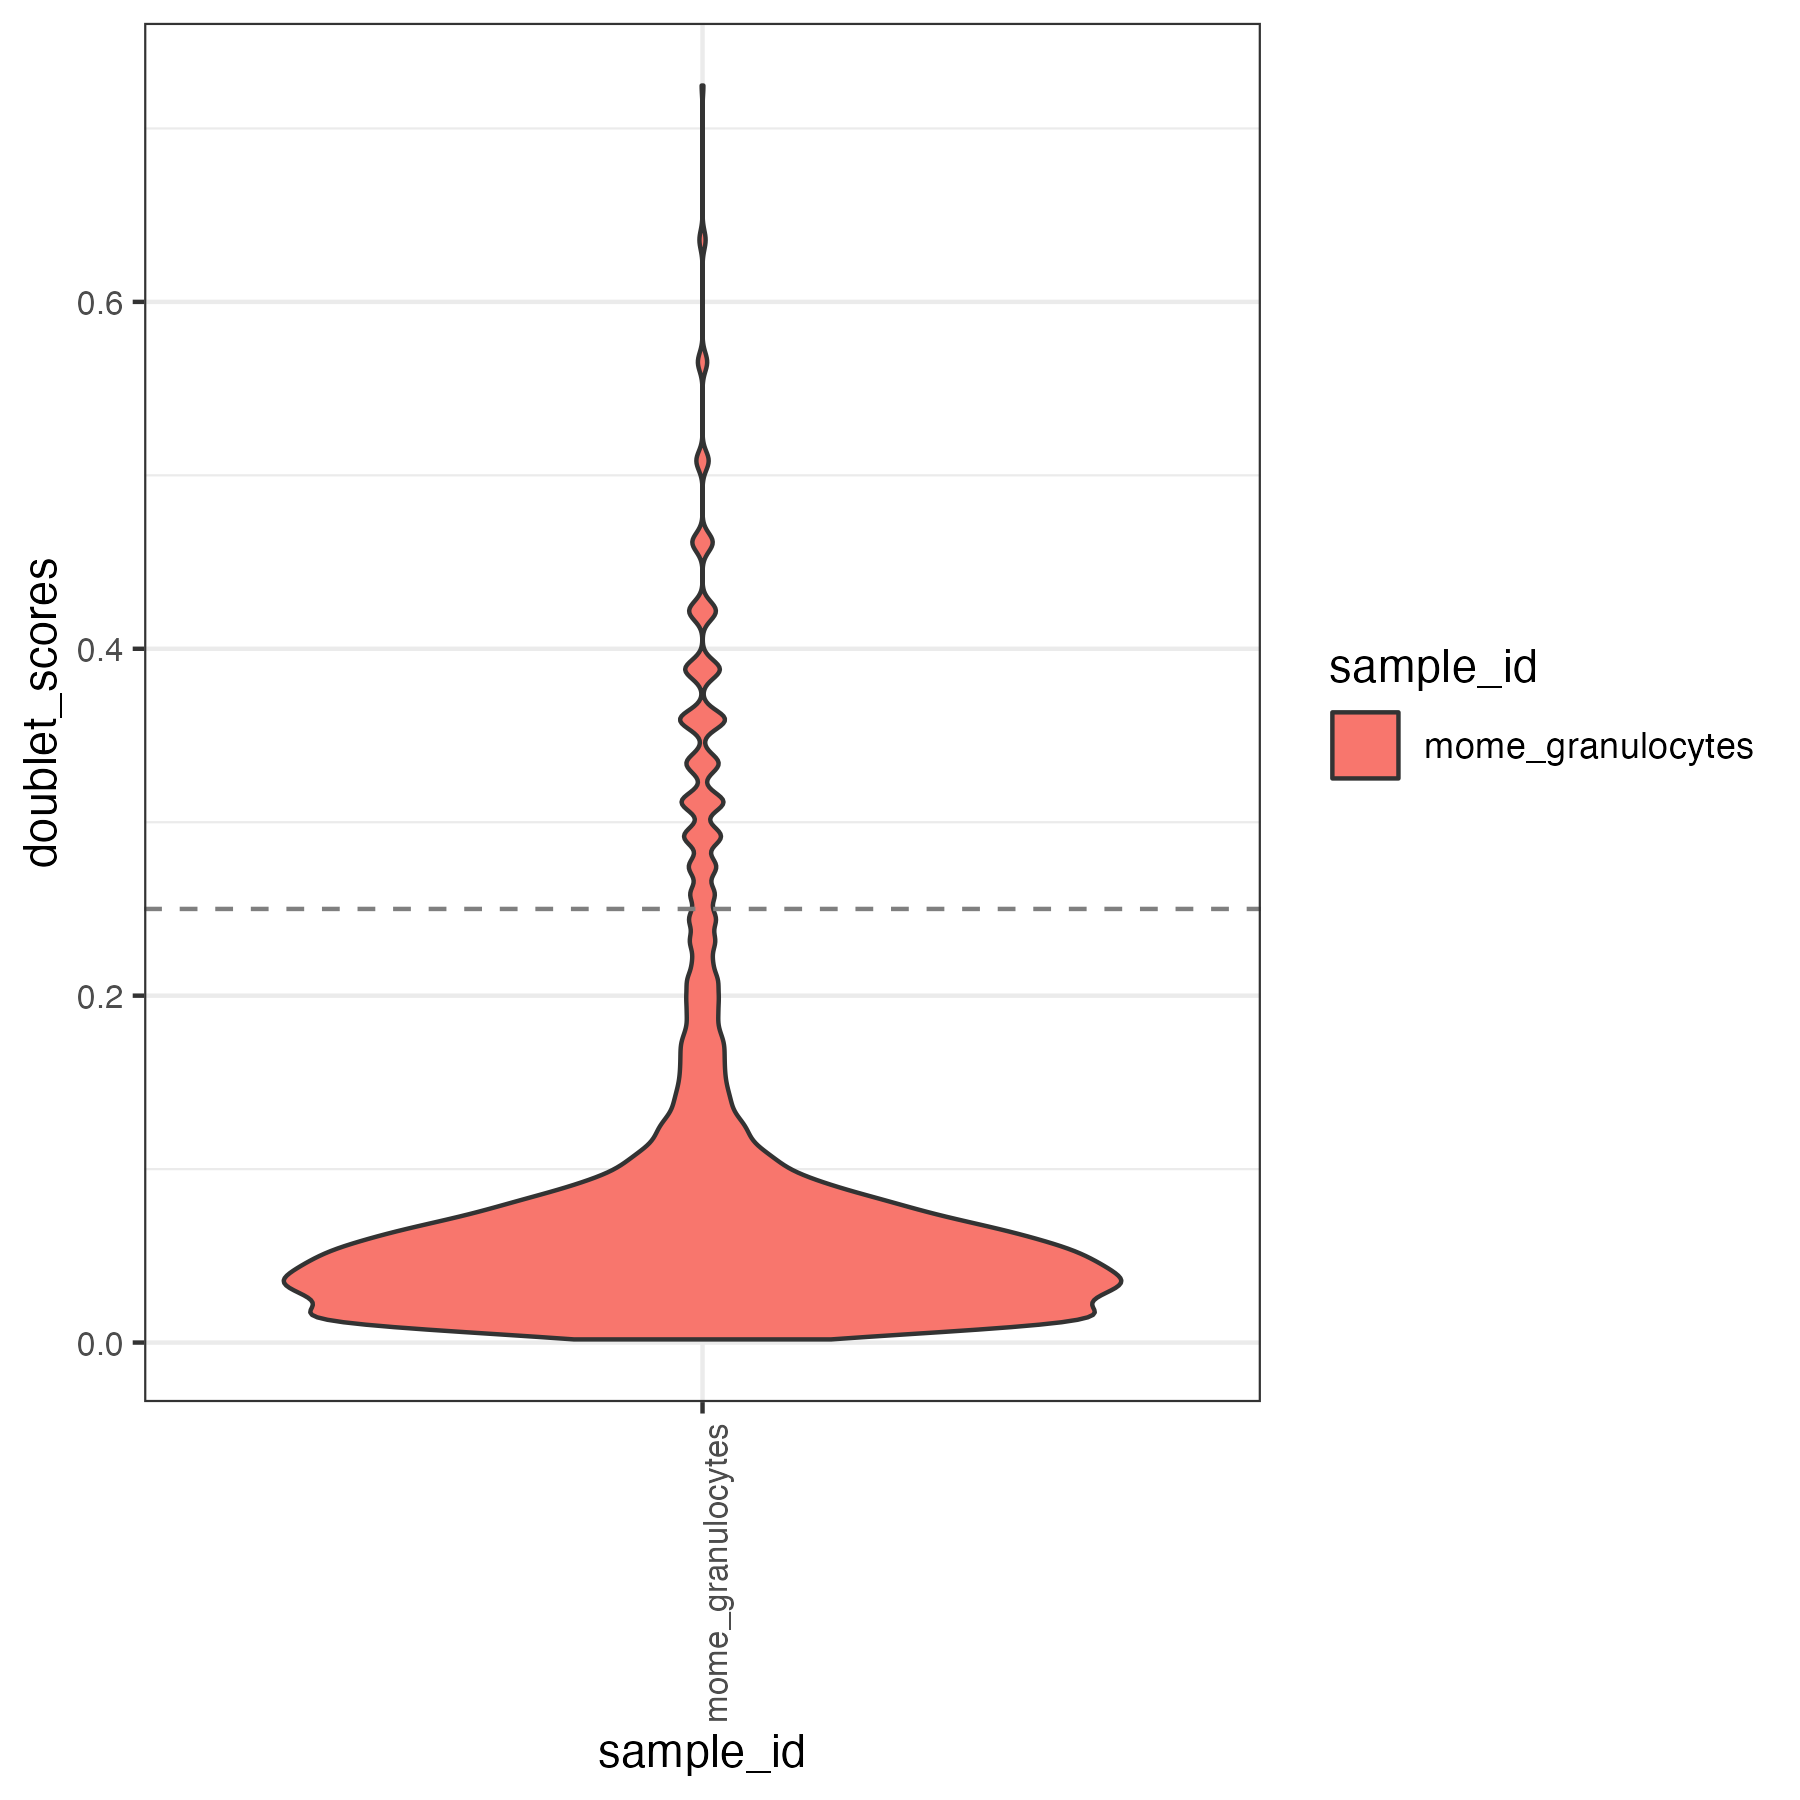
scrublet |
directory |
directory storing the scrublet analysis results |
tmp |
directory |
directory storing temporary h5mu files (one for each sample in the submission file) |
Let’s take a look at the figures folder to demonstrate how we have used the workflow to run some analyses on the newly generated mudata.
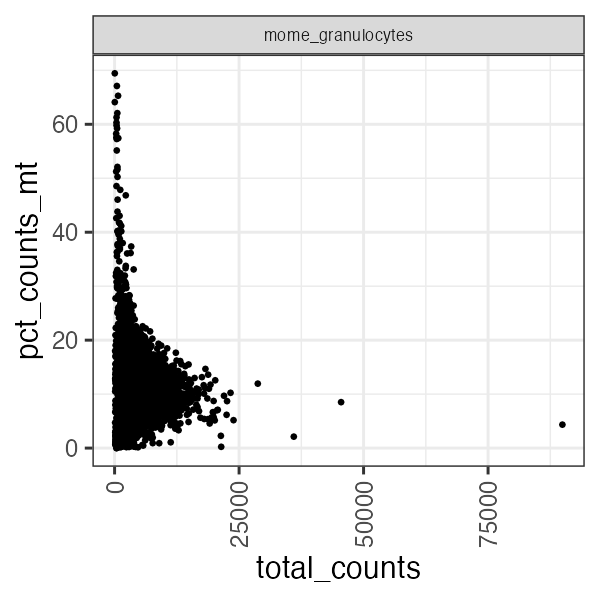
panpipes ingest workflow computes qc metrics for each modality given as input. For a multiome sample it may be useful to check RNA metrics such as number of genes detected in cells, percentage of mitochondrial reads per cell and library size.

Some atac useful metrics are also plotted, including percentage fragments in peaks, mitochondrial reads mapping to the open chromatin regions, tss enrichment.


To aid with the filtering of the data, we also produce outputs that simulate common filtering scenarios, the height of the bar shows the percentage of cells retained if the threshold is applied.
Users can also inspect the unfiltered mudata generated file by reading it in a python session:
import muon as mu
mu.read("mome_unfilt.h5mu")
We have demonstrated how to run the ingest workflow on multiome data. Filtering of cells and genes is not applied in the ingest workflow but in the preprocess. Inspecting these output should help the user to choose appropriate filters for their data!