Preprocessing spatial data with Panpipes
The preprocess_spatial workflow expects one or multiple MuData objects as input, each with a spatial slot. The workflow filters the data, followed by normalization, HVG selection, and PCA computation. The steps of the workflow are explained in greater detail here.
For all the tutorials, we will append the --local command which ensures that the pipeline runs on the computing node you’re currently on, namely your local machine or an interactive session on a computing node on a cluster.
Directories and data
For the preprocessing tutorial, we will work in the main spatial directory and create a preprocess directory for the preprocessing:
# mkdir spatial # <- if you don't have the spatial directory already
# cd spatial
mkdir preprocess
cd preprocess
In this tutorial, we will use the output Mudata objects of the Visium ingestion tutorial. Namely, the MuData files saved in spatial/ingestion/qc.data/:
spatial
├── preprocess
└── ingestion
    ├── data
    ├── figures
    ├── logs
    ├── qc.data # MuDatas with QC metrics
    │	├── V1_Human_Heart_unfilt.h5mu
    │	└── V1_Human_Lymph_Node_unfilt.h5mu
    ├── tmp
    ├── pipeline.log
    ├── pipeline.yml
    ├── sample_file_qc_spatial.txt
    ├── V1_Human_Heart_cell_metadata.tsv
    └── V1_Human_Lymph_Node_cell_metadata.tsv
The preprocess_spatial workflow allows you to preprocess one or multiple MuData objects of the same assay, i.e. Visium or Vizgen, in one run. For that, the workflow reads in all .h5mu files of the input directory. The MuData objects of the input directory are then preprocessed with the same specified parameters.
Edit yaml file
In spatial/preprocess, create the pipeline.yml and pipeline.log files by running panpipes preprocess_spatial config (you potentially need to activate the conda environment with conda activate pipeline_env first!).
Modify the yaml file, or simply use the pipeline.yml that we provide (you potentially need to add the path of the conda environment in the yaml). Note, that the filtering step is optional. You can avoid filtering by setting the run parameter under filtering to False. The pipeline will then only normalize the data, compute HVGs and run PCA.
Run Panpipes
Run the full workflow with panpipes preprocess_spatial make full --local
Once Panpipes has finished, the spatial/preprocess directory will have the following structure:
preprocess
├── figures
│   └── spatial
│       ├── pca_variance_ratio.V1_Human_Heart.png
│       ├── pca_variance_ratio.V1_Human_Lymph_Node.png
│       ├── pca_vars.V1_Human_Heart.png
│       ├── pca_vars.V1_Human_Lymph_Node.png
│       ├── spatial_spatial_total_counts.V1_Human_Heart.png
│       ├── spatial_spatial_total_counts.V1_Human_Lymph_Node.png
│       ├── violin_obs_total_counts_.V1_Human_Heart.png
│       ├── violin_obs_total_counts_.V1_Human_Lymph_Node.png
│       ├── violin_var_total_counts.V1_Human_Heart.png
│       └── violin_var_total_counts.V1_Human_Lymph_Node.png
├── filtered.data
│   ├──V1_Human_Heart_filtered.h5mu
│   └── V1_Human_Lymph_Node_filtered.h5mu
├── logs
│   ├── filtering.V1_Human_Heart_.log
│   ├── filtering.V1_Human_Lymph_Node_.log
│   ├── postfilterplot.V1_Human_Heart.log
│   ├── postfilterplot.V1_Human_Lymph_Node.log
│   ├── st_preprocess.V1_Human_Heart.log
│   └── st_preprocess.V1_Human_Lymph_Node.log
├── pipeline.log
├── pipeline.yml
└── tables
│   ├── V1_Human_Heart_filtered_cell_counts.csv
│   ├── V1_Human_Heart_filtered_filtered_cell_metadata.tsv
│   ├── V1_Human_Lymph_Node_filtered_cell_counts.csv
│   └── V1_Human_Lymph_Node_filtered_filtered_cell_metadata.tsv
You can find the final MuData objects in the spatial/preprocess/filtered.data folder. Additionally, the metadata of the filtered Mudata objects is saved as tsv files in the spatial/preprocess/tables directory, together with csv-files containing the number of spots/cells after filtering.
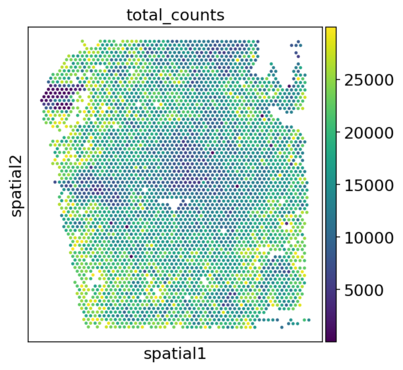
Post-filter plots are stored in spatial/preprocess/figures/spatial. The plots include visualizations of the spatial embeddings, as well as violin plots:

The PCA and the elbow plot are also plotted:


Note: We find that keeping the suggested directory structure (one main directory by project with all the individual steps in separate folders) is useful for project management. You can of course customize your directories as you prefer, and change the paths accordingly in the pipeline.yml config files!